Since the first wireless transmission, design engineers have been concerned about electromagnetic interference (EMI). Regulatory agencies have established EMI limits and specified measurement methods used in compliance testing. These methods have been used for decades. The purpose of writing these methods is to meet the analog broadcast needs of voice and video and the test methods used at the time of writing, such as the CISPR averaging method and quasi-peak detector. These measurement techniques are designed to provide acceptable levels of interference when the human ear and eyes receive sound and video, respectively. With the emergence of digitally modulated data transmission and ultra-wideband (UWB) transmission methods, coupled with the increasing frequency of unanticipated radiating devices in the form of high-speed digital clocks, the current EMI specification standards cannot fully address all types of interference currently present and their impact on communications The impact of the system.
Sudden short- and high-frequency interference that occurs sporadically in consumer electronics and communications is becoming more and more common, for example, mode-dependent spread-spectrum clocks used in computers and noisy periodic hard disk access cycles running in embedded system designs Hard drive. These complex digital devices are increasingly approaching wireless communication systems that operate in a frequency-agile, packet-based mode.
As the interference characteristics of the communication system change, so does the test equipment. The functions previously realized by analog circuits can now be realized digitally, and the measurement speed is continuously improved, and we can obtain the measurement results faster. The real-time spectrum analyzer launched by Tektronix can instantly view a very wide spectrum span without losing the information in the frequency band, so that it can discover, capture and measure transient peaks that are extremely challenging for traditional technologies.
Diagnosis, pre-compliance and conformance testing In the field of electromagnetic compatibility (EMC), different equipment and technologies are used at different stages of design and inspection. In the early stages of development, the combination of EMC design techniques and diagnostics resulted in lower EMI characteristics and low sensitivity to external and internal interference. A general-purpose spectrum analyzer with corresponding filters and detectors is usually used to determine the impact of design optimization on EMC. Usually the detection is done directly on the circuit board, or E-field and H-field probes are used to determine the impact of the design optimization and shielding effect. Of course, there is no limit to the diagnosis of excellent EMC performance; usually requires comprehensive diagnosis and debugging of system integration, in order to ensure that all RF subsystems reach the required performance level, and will not be degraded by other parts of the integrated system. Perform pre-conformance testing after system integration to determine problem areas in the design. Meeting international standards does not require pre-conformance testing. The goal of pre-conformance testing is to discover potential problems and reduce the risk of failure during the conformance testing phase. The equipment used can be non-standard equipment. If sufficient margin is added to the test results, its accuracy and dynamic range can be lower than that of the standard receiver. Pre-compliance testing can be done in certified laboratories using rapid measurement techniques designed to "view" problem areas quickly; pre-compliance testing can also be done by engineering designers at temporary locations. Pre-certification usually uses general-purpose spectrum analyzers that include corresponding filters and detectors because they provide fast measurement tools, which are often already used in the design process and require no additional capital expenditure. If problems are discovered at this stage, further diagnosis and design changes are required. In addition to diagnosis, the functions provided on the RSA6100A can also perform certain pre-conformance measurements. Figure 5 is an example of pre-conformance scanning, which combines the trajectory of CISPR QP detection with the antenna factor table and spurious signal search function. In this example, the trajectory is an "environmental scan", which examines the background signal that exists when there is no device under test.
Conformance testing requires compliance with methods, equipment and measurement locations specified by international standards. Conformance testing is usually done as part of the design inspection before equipment production. Conformance testing is exhaustive and takes a long time. EMC failure at this stage of product development may lead to expensive redesigns and delay product launches.
Filters, detectors, and averaging receivers and spectrum analyzers can be modeled as having receiver bandwidth, signal detection methods, and result averaging methods to complete signal level measurements.
In many commercial EMI measurements, these measurement units are specified by Comite InternaTIonal Special des Perturba TIons Radioelectriques (CISPR), which is a technical institution under the International Standards Organization, the International Electrotechnical Commission (IEC). Other standards and certification bodies, such as TELEC in Japan, also put forward requirements for measurement methods and certification techniques. The US Department of Defense has developed the MIL-STD 461E standard, which has special requirements for military equipment.
The measurement bandwidth is determined by the shape of the receiver bandwidth or the resolution bandwidth (RBW) filter of the spectrum analyzer. The test bandwidth is usually the frequency band where interference may exist in the frequency spectrum, and the test bandwidth varies with the frequency.
The detector is used to calculate a single point representing the signal at a certain point in time. The detection method can calculate the positive or negative peak, the RMS or average value of the voltage, or in many EMI measurements, calculate the quasi-peak (QP).
During the measurement, an averaging method is used for the detected signal. The averaging algorithm defined in the CISPR standard aims to reproduce the effects of reading signal values ​​using a voltmeter with a specified response time. By applying a specified bandwidth to the detected output, you can also use the "video filter" for averaging. For EMI testing, video filtering is specified in the TELEC standard.
Detection method Although many EMI measurements can be done using a simple peak detector, the EMI measurement standard specifies a special measurement method, a quasi-peak (QP) detector. QP detector is used to detect the weighted peak value (quasi-peak value) of the signal envelope. It weights multiple signals based on signal duration and repetition rate. QP detectors are characterized by fast response and slow decay, and contain a time constant representing the critical damping table. The QP measurement value of the signal with a higher frequency is higher than that of the occasional pulse.
Quasi-peak detectors have traditionally been used in analog designs, as shown in Figure 1.
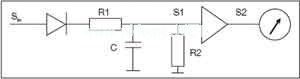
Figure 1 The quasi-peak detector in the simulation implementation. The characteristics of the quasi-peak detector with fast response (charge time) and slow decay (discharge time) are derived from the RC constant in this circuit
In Figure 1, as long as Sin is higher than S1, the envelope of signal Sin charges capacitor C to resistor R1. If the input signal Sin is smaller than S1, the resistor R2 will discharge the voltage S1.
To help view the response of the quasi-peak detector and related instrument combination, Figure 2 shows the input response (repeated pulses, shown in blue) and the resulting quasi-peak detector response (which has the characteristics of fast response and slow attenuation, shown in green) And the integrated response of the detector and instrument (indicated in red) is separated.
For the constant index on the receiver with QP detector, Figure 3 shows the relationship between the amplitude and repetition frequency described by the CISPR 16-1-1 standard.

Figure 2 Quasi-peak response to repetitive signals
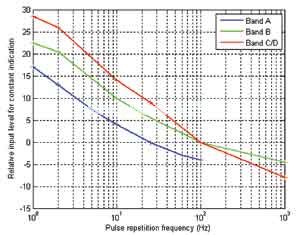
Figure 3 Impulse response curve of quasi-peak detector
Figure 4 is an example of peak detection and QP detection. Here, in the peak detection and QP detection, the signal of 8 μs pulse width and 10 ms repetition rate is viewed. The QP value obtained is 10.1 dB lower than the peak value. When measuring the EMI of the device under test, the peak value is usually measured first to find the problem area that exceeds or approaches the specified limit. Then only perform slower quasi-peak measurements on signals near or exceeding the limit. A spectrum analyzer with a standard peak detector is usually used to quickly assess any problem areas.
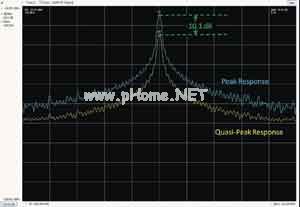
Figure 4 The effect of peak and quasi-peak detection on the 8μs pulse width and 10ms repetition rate signal, the quasi-peak is 10.1dB lower than the peak
In addition to QP detection, the real-time spectrum analyzer also supports the peak and average detectors specified in the CISPR specification. The peak detector detects the peak value of the signal envelope, and the average detector calculates the average value of the envelope. The real-time spectrum analyzer can simultaneously measure QP, peak value and average value from the same input signal, and understand the signal characteristics of the DUT in a unique way. Some EMI measurements specify a video filter, which is the earliest method used in spectrum analyzers to reduce the impact of measurement noise changes. The term video filter is derived from the earliest implementation, that is, the low-pass filter is placed between the detected output and the Y-axis analog drive input of the spectrum analyzer CRT. Real-time spectrum analyzers and some modern spectrum analyzers use digital technology to smooth the noise on the signal.
In most EMI measurements, the video filter is specified to be off, or the video filter is specified to be at least three times higher than the specified RBW measured (see Table 1).

The purpose of specifying that the video filter is turned off (or not less than 3 times RBW) is to eliminate the influence of the video filter on the detected signal. Figure 4 shows the effect of video bandwidth when the ratio of video bandwidth (VBW) to RBW changes. When VBW≥3 * RBW or 10 * RBW (or failure), the standard deviation of noise is kept at 5.4dB. When VBW = RBW, for example in the TELEC specification section, the noise variation is reduced to about 4.7dB.
Digital implementation of EMI filters, detectors, and averaging algorithms. For spectrum analyzers based on discrete Fourier transform (DFT) technology, filtering can be performed digitally by applying window functions to discrete acquired data. The sampling rate depends on the required bandwidth of the filter. When the sampling frequency is the same, more samples are required to achieve a smaller filtering bandwidth.
The real-time spectrum analyzer uses the Kaiser window to simulate the EMI filter. The frequency response amplitude of the window function determines the shape of the IF filter, which must meet the bandpass selection limits specified in CISPR 16-1-1.
In real-time spectrum analyzers, quasi-peak detectors are implemented using digital filters. You can use digital filters, such as infinite impulse response (IIR) filters, to emulate the RC charging and discharging circuits used in traditional EMI receivers. This critical damping table can also be modeled as a second-order digital IIR filter. The maximum value displayed on the meter is taken as the quasi-peak detector value.
On a real-time spectrum analyzer, the video filter is implemented using averaging technology. The average number used depends on the video bandwidth selected and the RBW used in the measurement. When using VBW, the obtained measurement and analysis length depends on the selected VBW. If RBW is used when there is no video bandwidth, it will be longer. The average number of real-time spectrum analyzers is selected to achieve a good correlation with noise changes on the VBW / RBW curve, as shown in Figure 5.
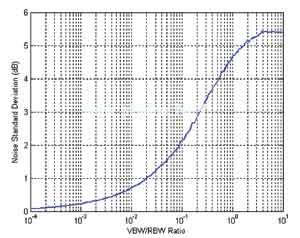
Figure 5 The effect of the VBW / RBW ratio on the standard deviation of random noise signals. When the resolution bandwidth of VBW is not less than 3 times, it has no practical effect on the signal deviation of VBW
Measurement speed and real-time spectrum analyzer
The measurement speed of QP and mean value has always been a challenge for measuring receivers and spectrum analyzers. QP detectors and meters have long response times, so it is not practical to scan one frequency at a time over a wide range of frequencies. To solve this problem, the measurement is done using a peak detector, which can quickly determine the highest EMI peak in the device under test. Then use single frequency measurement in all problem areas and repeat the measurement. Recently, receivers and real-time spectrum analyzers capable of handling large signal spans have appeared on the market. The speed of applying QP detection and averaging functions is several orders of magnitude higher than that of single frequency measurement technology. This method of calculating all frequency points in the bandwidth has a clear speed advantage. Compared with the scanning technology, there is another advantage: you can view the transient signal in the frequency band with a much higher listening probability. This is particularly important in the current design environment, because the signal changes and moves with time, and single frequency measurements cannot represent these dynamically changing signals.
Find current EMI problems Although the standards-based measurement methods described above are essential for legal compliance testing, they often cannot solve or even detect the problems faced by EMI designs in current systems.
Fortunately, the development of measurement technology can already meet these needs. The above describes how to use the real-time spectrum analyzer to find the transient signal and EMI hidden trouble. In the following example, a single transient signal will produce a series of transient signals, these signals last only a short time. In this example, the device is an embedded system that causes transient EMI when caching data to the hard disk. After a simple inspection using the peak detector of the swept frequency analyzer (yellow trace, as shown in Figure 6), there seems to be only one continuous signal; keep the instrument in Max-hold for a few minutes while cycling the DUT operating mode, which will indicate the problem (blue Color track). However, a quick scan in peak detection mode will give a yellow trace, and no problems are detected.

Figure 6 The transient EMI that was missed in the peak scan (yellow trace) of the swept frequency analyzer was found after the DUT cycled through the disk cache operation and remained in Max-hold mode for one minute
Figure 7 uses Digital Fluorescence Processing (DPX) technology to examine the EMI characteristics of the DUT and immediately discover the problem. The unique DPX spectrum display technology of the Tektronix real-time spectrum analyzer can process more than 48,000 spectrums per second, ensuring that signals with a duration of more than tens of microseconds can be instantly captured and displayed. In FIG. 6, signals with a higher frequency of occurrence are shown in red, and signals with a lower frequency of occurrence are shown in blue and green. In this way, you can immediately see which signals are continuous and which signals are transient. Transient signals occur occasionally, but their level is 15dB higher than continuous signals.
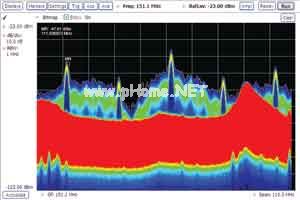
Figure 7 The occasional transient signal found after 5s using DPX. The red area is a signal that occurs frequently, the blue part and the green part are transient signals
After using DPX to discover potential problems, it is necessary to trigger and capture signals for further analysis. By defining a frequency mask trigger based on a continuous signal curve and then capturing occasional transient signals in the spectrum, you can easily trigger and capture the signal. Any signal whose duration exceeds 10.3μs and is higher than the frequency mask threshold will cause triggering, and the signals before and after triggering are stored in the memory. The three-dimensional spectrogram on the left side of Figure 8 shows the four acquisition results triggered by the transient signal.
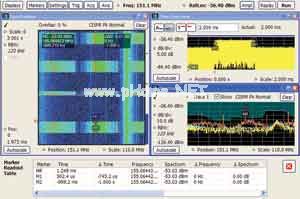
Figure 8 Using the frequency template trigger technique to capture the transient signal that occurs at a 1s repetition rate
The signal can now be fully analyzed. The mark in Figure 8 shows that the repetition rate of the transient signal is 1.0s, but the length of the transient signal is not always the same, but changes between 752μs and 200μs during 5 acquisitions. This repetition frequency and varying pulse width provide important clues to determine the source of the transient signal in the circuit. In this case, it is the disk cache operation, which only occurs under the special operating conditions of the device under test.
Summary Conducting standards-based EMI measurements requires the use of special filters and detectors specified by the standards body. Receivers, traditional spectrum analyzers and real-time spectrum analyzers provide these special filters and detectors. The measurement speed of the DSP technology used by real-time spectrum analyzers and some receivers is several orders of magnitude faster than the frequency sweep method because it can simultaneously analyze the entire real-time bandwidth (up to 110MHz).
Compared with the frequency sweeping technology, the real-time analysis technology greatly shortens the minimum signal duration required to ensure the probability of 100% transient signal interception. By using a real-time spectrum analyzer with DPX spectrum processing technology, you can easily debug the system that generates various transient signals to ensure that transient signals are not missed during the analysis. This shortens the time to obtain information and improves confidence in determining the quality of the device under test.
Outdoor LED screen AD poster become the Best Advertising choice and the best money earning machine
This Type of Outdoor Led Poster also called led AD player is one of new applications for led displays. Developed from led screens, it is more suitable and friendly to operate. Don't need to install as it is floor standing. and could be put anywhere it needed indoor or outdoor environment.
Optional Pixel Pitch 4mm,5mm,6mm.optional sizes 60`'.IP65/54, weather proof; Ultra Outdoor HD led display poster, crystal clear and vivid images; High brightness and auto adjustment according to environment; Intelligent group management, easy and convenient. Thanks to the Cluster controll system and GPS technology, no matter how many posters you have where they are, you could controll them easily and change content quickly.
They are one of none stop money earning machines!
Floor Standing Outdoor Led Poster
Floor Standing Outdoor Led Poster,Outdoor Custom Led Signs,Oudoor Hd Led Display,Oudoor Led Window Display
Shenzhen Priva Tech Co., Ltd. , https://www.privaled.com