1. Introduction The development of automotive technology depends largely on the development of test technology. Automobile companies with leading technology abroad have advanced test technology and complete test facilities, especially an engine laboratory composed of a considerable number of test benches. There are many engine test indexes, and engine test technology is an important part of automotive test technology and the most complicated part. The main indicators to measure the power and economy of the engine are: power, torque, speed, fuel consumption, etc. The parameters measured in the conventional engine performance test are the engine power, torque, speed, fuel consumption and fuel consumption rate, fuel temperature , Lubricating oil pressure and temperature, intake pressure and temperature, exhaust temperature and pressure, cooling water inlet and outlet temperature, etc.
Various parameters of the engine are measured in real time by various types of sensors. Modern high-level laboratories can measure hundreds of parameters at the same time; some parameters can be directly measured, and some parameters need to be calculated based on the measured parameters and formulas. Modern test equipment generally provides post-processing of data. The final processing results of the required data can be provided according to user requirements in the form of tables and curves.
According to the thermal performance index of automobile engine test, this paper designs the automobile engine thermal performance test system, which can detect the multi-point temperature, pressure, flow rate of automobile engine, etc. For data processing and report generation, the entire test system has a simple structure, convenient operation, good reliability and high accuracy.
2. Test content
2.1 Cooling water flow measurement: the maximum temperature of the cooling water is 150 ℃; the maximum flow is 10m3 / h; the pipe diameter: φ30. Features: The pipeline space is relatively narrow, there is no straight pipe section before and after, and the original pipeline structure is not changed during measurement to ensure that the pipeline resistance characteristics remain unchanged. Measurement accuracy: ± 0.5% ~ 2%; measurement points: 1 point.
2.2 Pressure measurement and data collection: the medium is cooling water; the maximum pressure: 2.0kgf / cm2; features: the sensor installation space is small, the size of the pressure sensor is required to be small; accuracy: ± 1%; the number of measurement points: 2 points.
2.3 Temperature measurement: It is necessary to measure the temperature of cooling water, engine surface, internal environment, etc., temperature measurement range: <1000 ℃; accuracy: ± 1 ℃, measurement points: <100 points.
2.4 Voltage measurement: To detect the voltage of batteries, fans, etc., measurement range: 0 ~ 15VDC; measurement accuracy: ± 0.1V; measurement points: 2 points.
2.5 Cooling air volume measurement: It is required to measure the air intake volume in front of the condenser, and within a certain cross-sectional area (450 × 800) on the surface of the condenser, measure the distribution of wind speed and air volume at each point; measurement point arrangement: ≤20 . Wind speed measurement range: 15m / s (peak value <50m / s), measurement accuracy: ± 2.5%
2.6 Humidity measurement: measuring the humidity of the environment at that time, with a measurement accuracy of ± 2%. Points: 1 point.
2.7 Vehicle speed measurement: The system has an online vehicle speed measurement function, the measurement range: 10km / h ~ 160km / h, and the number of points: 1 point.
3. Test system design The test system consists of three layers, namely: measurement and transmission layer, data acquisition and signal conversion layer, and data processing layer. The structure of the test system is shown in Figure 1.
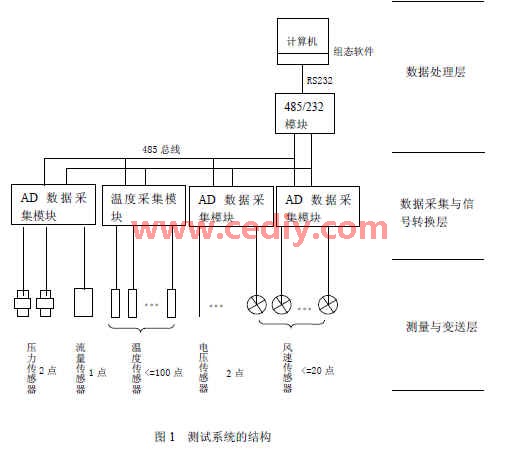
The measurement transmitter layer is composed of various sensors, including pressure sensor, ultrasonic flowmeter, thermocouple, voltage sensor, wind speed sensor (anemometer), etc. Most of the above sensors can be detected with standard sensors, but the design of the engine cooling air volume detection sensor is relatively difficult. The reasons are as follows: 1) The electromagnetic interference is strong, and the electromagnetic interference near the car engine is very strong. The author opened the front cover of the car, started the engine, and placed the electromagnetic anemometer near the car engine. , The anemometer shows a maximum wind speed of 3 m / s. 2) The high temperature environment and the high temperature near the engine prevent normal electronic components from working properly. 3) The detection position is narrow, and the thickness of the detection device cannot exceed 25mm.
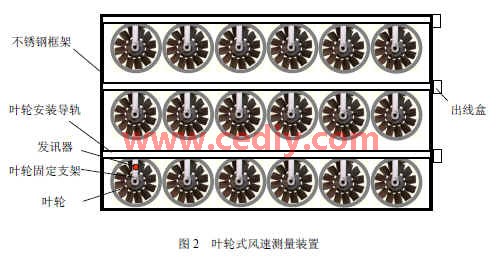
Due to the above reasons, the air volume detection sensors on the market obviously cannot meet the demand and have to be designed by themselves. According to the requirements, the design is as follows: In order to overcome the high temperature and strong electromagnetic interference in the car, a high temperature resistant reflective photoelectric sensor is selected. The detection signal is transmitted to the amplification and shaping circuit through the high temperature shielded signal line, and then sent to the CPLD. Multiple frequency signals are detected. as shown in picture 2.
Through wind tunnel experiment calibration, the relationship between wind speed, local wind volume and impeller rotation frequency is established:
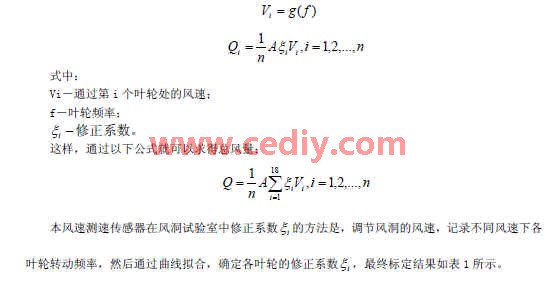
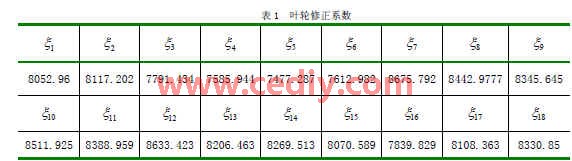
Taking a certain foreign model car as an example, the cooling fan of the car is turned on. The test system is used to test 3 times in succession to test the air volume of a car at different driving speeds. The air volume unit is m3 / h. Test value under the same conditions. See Table 2 for specific test data. 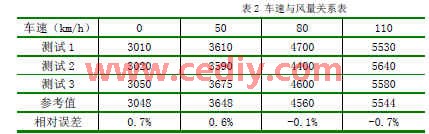
The data tested above is basically consistent with the results of the company's testing in North America using foreign test systems.
4. The software design software system uses the famous American "LABVIEW" configuration software as the computer software development platform. The data processing layer uses the computer to transfer the data on the RS485 bus (converted to RS232) to the computer. Through the computer software, real-time data display (including trend graph display), data analysis, data storage, report generation and printing are realized. Printing reports is a basic function generally required by measurement and control systems. Microsoft Excel is a powerful data processing software with extremely wide applications. By combining with LabVIEW, the collected data is transferred to Excel, and the functions of both are fully utilized. After the test, the tester can view the data in the Excel file for other further processing.
5. Conclusion The system has been successfully applied in the laboratory of an automobile research center. The actual operation results for more than one year show that it can fully meet the needs of engine thermal parameter measurement, with high test accuracy and stable performance. Due to the use of bus structure, the system is expanded It is also very convenient. The author's innovation is that most of the domestic testing of automotive engine thermal parameters is based on the testing of certain parameters separately. The research on the comprehensive test system is in its infancy. There are no similar products. This system can test multiple parameters at the same time. It is helpful to analyze the performance of the engine. In addition, the detection of engine cooling air volume under high temperature and strong electromagnetic interference environment is solved.
Cat5E Connector,Cat5E Plug,Cat5E Utp Connector,Cat5E Stp Connector
Dongguan Fangbei Electronic Co.,Ltd , https://www.connectorfb.com